Identifying oxbow lakes from satellite data
TL;DR
- We identified oxbow lakes from Sentinel-1 (SAR) and auxillary data from the Global Surface Water Explorer
- Interactive map of the oxbow lakes in western New Guinea
- Source code on Github
For the course Geoscripting at Wageningen University & Research, we learned to do process geospatial data using R, Python, bash and Google Earth Engine. In the final week, we had the opportunity to integrate all that knowledge in a single project. Together with my group members1, we created an algorithm that can distinguish oxbow lakes from Sentinel-1 synthetic aperture radar (SAR) imagery.
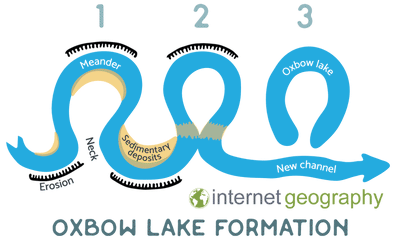
For the (many) who are not aware what an oxbow lake is; they are crucial freshwater wetland ecosystems that are formed when the neck of a meandering river is breached. Over time the old meander of the river will be disconnected from the main channel through sediment deposition, like depicted below2.
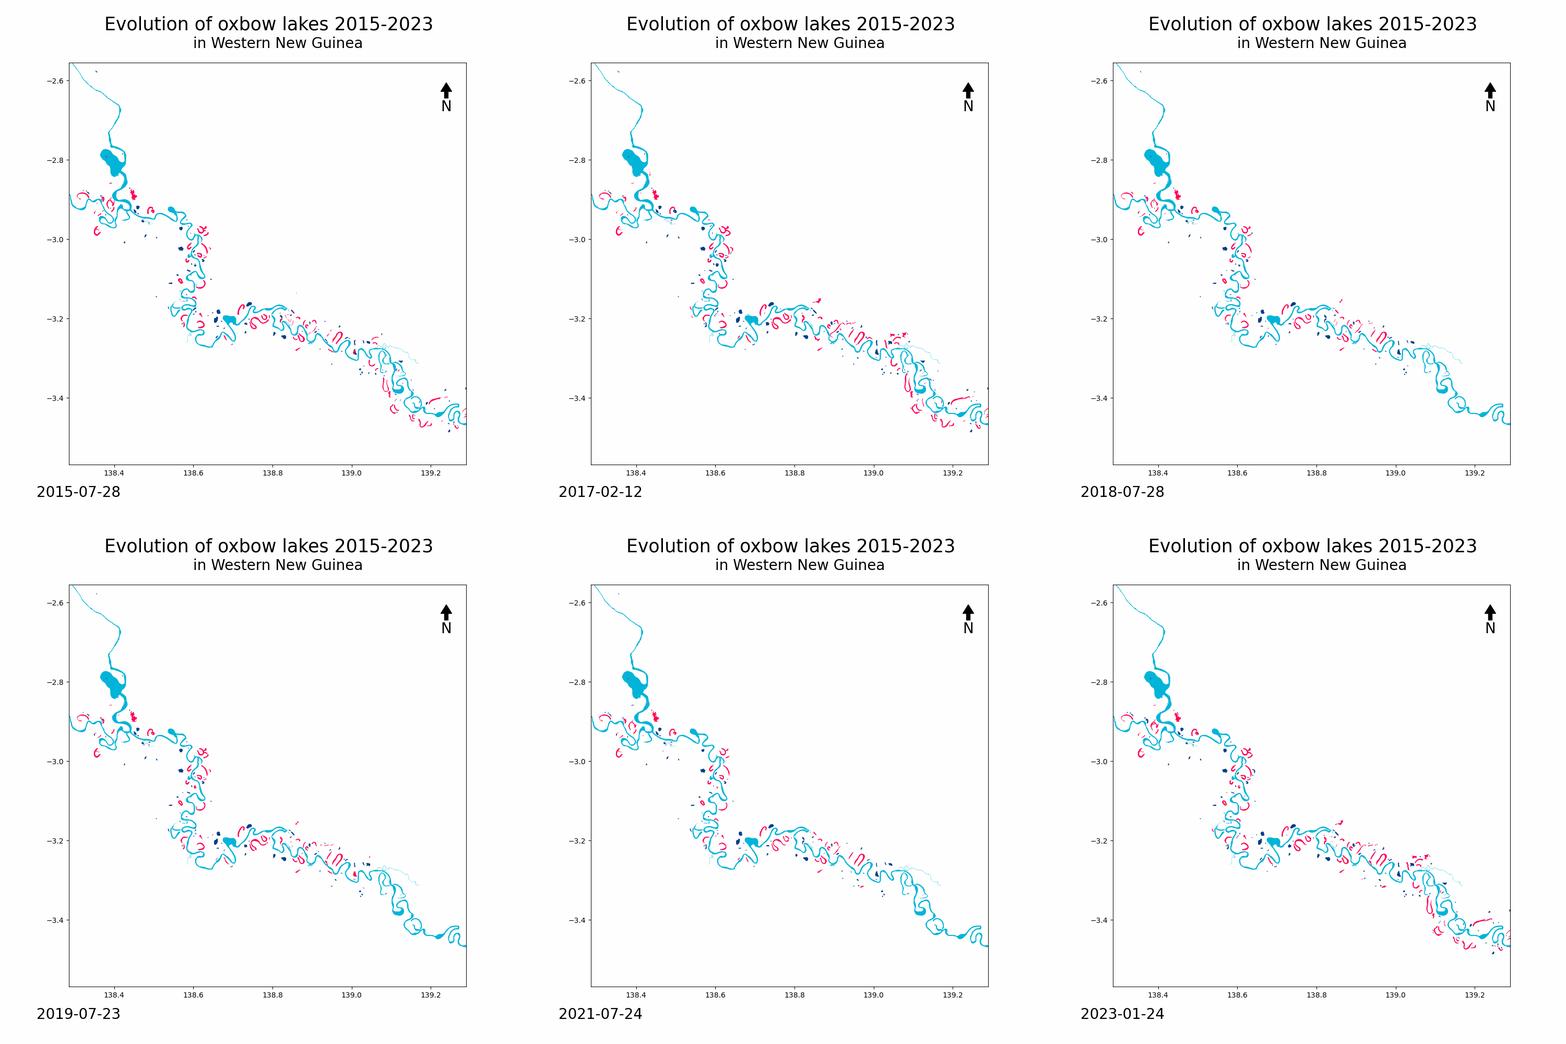
When visualized using a time series of satellite imagery, the effect becomes even more pronounced as seen in our study area of western New Guinea
In brief, the following method was used:
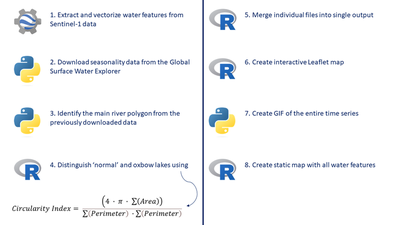
Which lead to the following results:
- Interactive map through Leaflet
- Dynamic map (GIF)
- Static map
First, was the interactive map of the area where the user can pan and zoom to their desired location. The Leaflet map also allows users to select the year of their choice while also having the option to (de-)select the showing of ‘normal’ or oxbow lakes. Test it yourself with this link!
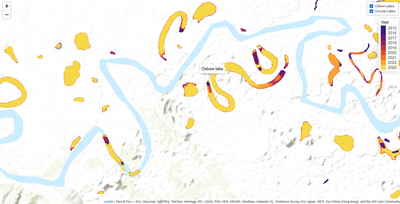
The second visualization created was a GIF of the entire time series. This would allow users to see if certain lakes grew or shrink during the entire period, however, due to processing limits we only selected a few images which limits the application of this method.
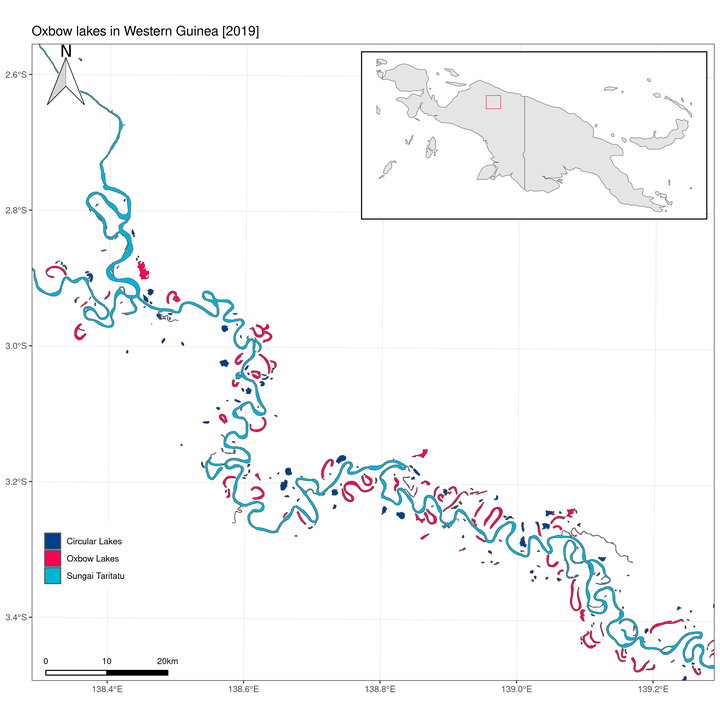
The last method is a static map of all the water features found within the study area. Through a Bash script users were prompted to select a year of their choice which would output an image like seen below. This was my first time creating an inset map through scripting which was a challenge to implement but eventually led to some good-looking results.
![Static map of the water features in western New Guinea [2019]](/media/figure_oxbowlakes-static2019_hu856d8b0218efa8de72f4eafa58dcefe5_832717_258a7a24c0aa8f3e9efccce44ab67e8a.png)
The past four days were intense but were rewarding. In a short amount of time, we managed to write an algorithm that is reasonably good at identifying oxbow lakes from SAR data. Personally, I improved a lot in my scripting abilities (both R and Python) while also learning how to use Bash.
Feel free to download and re-use the code available on Github!
-
With Isaura Menezes de Oliveira Guido, Isabeau Verbrugge, Wessel van Leesten & Nikolas Theofanous ↩︎
-
Image sourced from Internet Geography ↩︎